- Role
- Full-Stack Developer, lead frontend
- Period
- 2024 - 2025
Under NDA. The numbers are real, and I'm happy to walk through the product on a call.
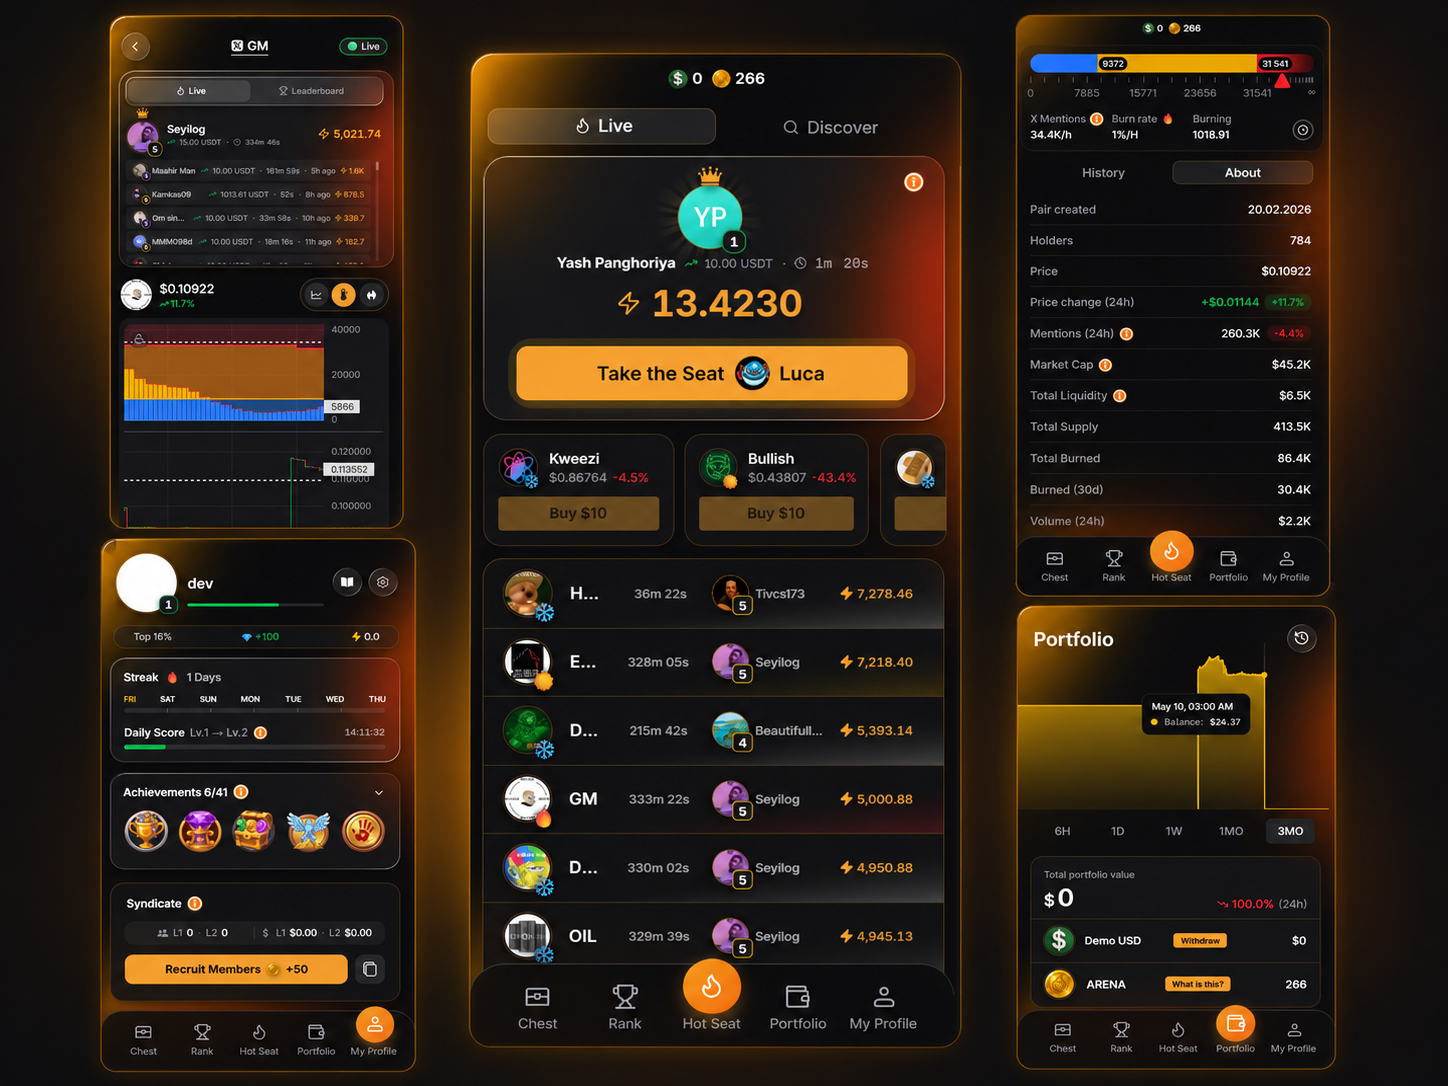
A real-time analytics surface for fast-moving tokens: sentiment overlays, token ranking, watchlists, and custom multi-layer charts, running on a demo wallet across web and Telegram.
Data layers on one chart
Price, hype, burn, supply and market cap, drawn in sync on one custom engine. Off-the-shelf libraries can't do that.
Stages, tweet to token rank
A trending topic becomes a token's live ranking through a six-stage hype engine.
Real-time, no refresh
Candles, sentiment and rankings stream into the UI the moment they change.
What I built
Frontend-focused fullstack: the trading UI and how it reads on a phone, the custom charting layer, and the data flows behind token analytics.
What it had to run inside
- Surfaces
- Web and a Telegram mini-app from one codebase, fast first paint on both.
- Data
- Price, sentiment, supply and burns updating live, together, without jank.
- Devices
- Mobile-first, touch charting, a tight bundle budget.
- The custom chart engine became the production charting foundation and stayed in use after launch.
- A token reads the same on web and inside Telegram.
What I chose (and what I didn't)
- Lightweight Charts
- TradingView's lightweight base instead of Chart.js or D3: fast, and extensible enough for custom layers.
- A custom chart layer
- Built on top of the library rather than fighting it; every data layer sits on one synchronized view.
- MobX + Redis reads
- Optimistic stores with Redis-backed reads instead of re-fetching, so frequent updates stay smooth.
- One engine, two surfaces
- Shared chart code for web and Telegram instead of a fork to keep in sync.
Keeping it fast under constant updates
Realtime data, a heavy trading UI and a tight mobile budget, all at once.
- Frequent updates
- Candles and sentiment flow into MobX with optimistic writes and Redis-backed reads.
- Charting on mobile
- A custom layer over Lightweight Charts tuned for touch, not a heavy widget.
- Bundle budget
- Custom utilities over heavy packages; non-critical UI loaded lazily.
Tech stack